Reporter Expression and Tissue Depth Quantification Using Bright and Broad-Range Spectrum Bioluminescence Probes
Received: 19-Sep-2017 / Accepted Date: 01-Nov-2017 / Published Date: 06-Nov-2017 DOI: 10.4172/2090-4967.1000148
Abstract
Bioluminescence imaging is widely used to study biological processes in small animal models. Such technique suffers from absorptive and scattering properties of tissues preventing to assess depth and expression of a given bioluminescent reporter. We developed a broad-band highly bioluminescent probe and studied its selective absorption according to tissue depth using tissue-mimicking phantom. Our probe, named YFP-Nluc consisting of the Yellow Fluorescent Protein (YFP) fused with the Nluc luciferase (Nluc), emits two distinctive peaks at 444 nm (Nluc) and 530 nm (YFP) upon bioluminescence resonance energy transfer (BRET). Upon expression in HEK cells, we show that the YFP-Nluc emission spectra is selectively and gradually modified upon increase of the hemoglobin concentration simulating multiple tissue depths. Furthermore, we found a linear correlation between the hemoglobin concentration and the bioluminescence ratio of YFP-Nluc corresponding to the spectra band-pass of 530-550 and 570-590 nm. Such probe opens possibility to determine, in the context of dual bioluminescence small animal imaging, the depth and signal strength without requiring the use of complex and time-consuming tomography based methods.
Keywords: Bioluminescence; Probes; Fluorescent protein
Introduction
in vivo optical imaging enables quantitative or semi-quantitative analysis of bioluminescent reporter probes to assess pathologies [1,2]. Bioluminescence imaging (BLI) approaches suffer from substantial limitations due to light scattering [3] leading to low spatial resolution and tissue absorption [4] affecting the signal intensity in relation to the source depths [5,6]. As a result, various technical methods have been developed to take into account those issues. First, to compensate for the loss of photons absorbed in tissues [7], in vivo imaging system are built with cooled CCD [8] camera enabling high sensitivity for deep image source or weak bioluminescence signal. Second, although the majority of in vivo bioluminescence studies do not take into consideration the depth of probe location while quantifying bioluminescence signal, few examples described in the literature are proposing alternative solutions using tomography.
Such method named Bioluminescence Tomography (BLT) [9] requires multiple acquisitions of bioluminescence performed with different angles. Next, the in vivo light path must be reconstructed using complex algorithms and mathematical formulas [10-12] leading upon small disturbances during the recording to significant errors [13]. As a result, lengthy time acquisition and complex kinetics of in vivo bioluminescence substrate, reported to lead to time-dependent variations of bioluminescence intensity [14] interfere with the 3D reconstruction.
To address this issue, costly multi-camera approach can be developed to collect simultaneously the bioluminescent signal from different angles and hence reduce the imaging time [15]. Alternative approaches using hyperspectral and multispectral bioluminescence optical tomography take advantage of the wavelength dependence of imaging depth [16,17]. Such method based on light collection through several narrow band-pass filters is not wildly adopted, although it was shown to reduce localization errors upon software reconstruction [18]. Interestingly as today, BLT 3D method applied in laboratories, mostly rely on dual-modality involving BLI together with MRI [19], SPECT [20] or micro-CT scan [19] in order to gather structural and anatomical information [21]. A solution that remains time-consuming and extremely expensive.
For this project, we decided to follow the multispectral bioluminescence strategy and develop a probe with sensitivity build in tissue depth signature. To do so, we engineered a bioluminescent fusion protein named YFP-Nluc composed of a bioluminescent donor Nanoluciferase (Nluc) and the Yellow Fluorescent Protein (YFP). Our model takes advantage of the bioluminescent and fluorescent reporters.
The Nluc extreme brightness known to be 150-fold superior to Renilla and firefly luciferases [22] provide sufficient bioluminescent signal to avoid the need for high cost cooled camera [23] and to suffer from long acquisition time due to narrow spectral detection. In addition, the YFP-Nluc bioluminescent reporter emits two distinctive peaks at 444 nm and 530 nm corresponding to the Nluc and YFP respectively. The resulting broad-band emission of YFP-Nluc improve the probe depth analysis upon emission spectrum as demonstrated in the following study with phantoms composed by gelatin, lipids and different concentrations of hemoglobin to simulate probe depth in tissues.
Material and Methods
Plasmid construction
Nluc was amplified from pNL1.1 plasmid (Promega, Madison, WI). Both constructions used the backbone plasmid pEYFP-N1 (Clontech, Mountain View, CA) which carried the human cytomegalovirus promoter CMV controlling the expression of the proteins of interest Nluc and YFP-Nluc. A 10 amino-acid linker was used to fuse YFPNluc. Plasmids’ concentration was then measured using NanoVue device (GE Healthcare Lifesciences, USA).
HEK cell culture
HEK cells named HEK-293 cells were maintained in Dulbecco’s modified Eagle’s medium ([+] 4.5 g/L D-glucose, [+] L-glutamine, [+] 110 mg/mL sodium pyruvate) (Gibco, ThermoFisher Scientific, Waltham. MA), supplemented with 10% fetal bovine serum, 100 unit/mL penicillin and 0.1 mg/mL streptomycin at 37°C in a humidified atmosphere containing 5% CO2. A day before transfection, HEK cells were seeded in 384-well flat (F) bottom Clear plates (Greiner, Bio One GmbH, Frickenhausen, Germany) at the concentration of 5000 cells per well (45 μL). Prior seeding the cells, the 384-plates were coated with fibronectin (BD Biosciences, Heidelberg, Germany).
Transfection
Transfections with mammalian expression plasmid encoding for the indicated fusion proteins were performed using FuGENE 6 Transfection Reagent (Promega, Madison, WI) and Opti-MEM 1X + GlutaMAX Reduced Serum Medium ([+] HEPES, [+] 2.4 g/L sodium bicarbonate), (Gibco, ThermoFisher Scientific, Waltham. MA). 0.15 μL of FuGENE 6 was mixed with 3.8 5 μL of Opti-MEM buffer and incubated for 5 min at room temperature. 50 ng (1 μL) of each plasmid construction was added to the mix and incubated for 30 min at room temperature. 5 μL of the plasmid mix was then added to the seeded HEK cells in each well. Cells were incubated for 48 h prior spectral acquisition.
Tissue mimicking phantom
Phantom reagent: Tris(hydroxymethyl)aminomethane, sodium azide, gelatin (from porcine skin), hemoglobin (from bovine blood), intralipid 20% and sodium chloride were all purchased from Sigma Aldrich (St. Louis, MO).
Phantom construction: Tissue mimicking phantoms were built using TBS Tri-buffered saline (50 mM Tris, pH 7.4 and 150 mM sodium chloride) as a buffer mixed with 10% gelatin and 0.1% sodium azide [24]. The solution was warmed up to 50°C while stirring until the complete dissolution of gelatin in the buffer. The solution was cooled down to 4°C while stirring and 1% intralipid was added as well as the desired amount of hemoglobin. The solution was poured into a 384 well plate (75 μL per well) and stored overnight at 4°C to allow the solidification of the phantom.
Hemoglobin absorbance spectrum: Several concentrations of hemoglobin diluted into TBS (from 0 to 34 g/L, dilution 1/10 compared to the phantom concentration) were poured in a black transparent 384 well plate (75 μL per well). Absorbance spectra of hemoglobin solutions were performed using SpectraMax M5 microplate reader (Molecular Devices, CA) from 350 to 650 nm with a 2-nm step increment.
Suspension and count of the transfected cells
The spent media was removed, HEK cells were washed using 10 μL PBS. 10 μL Trypsin-EDTA (Gibco, ThermoFisher Scientific, Waltham. MA) was added in each well. After rotating the 384 well plate to cover all the cell layer with trypsin, the plate was incubated at 37°C in a humidified atmosphere of 5% CO2 for 3 min. Transfected HEK cells were then collected in an Eppendorf tube with cell media. After 3 min centrifugation at 900 rpm, HEK cells were suspended in 100 μL of fresh cell media and counted using a hematocytometer.
Emission spectrum of transfected cells through gelatin phantoms
20000 transfected HEK cells (10 μL) expressing Nluc and YFP-Nluc proteins were mixed with 5 μL of furimazine (Promega, Madison, WI) diluted at 1/100 range with Dulbecco’s modified Eagle’s medium ([+] 4.5 g/L D-glucose, [-] L-glutamine, [-] sodium pyruvate, [-] phenol red) (Gibco, ThermoFisher Scientific, Waltham. MA) into each well. The mix was then poured in the wells containing the gelatin phantoms with several concentrations of hemoglobin (from 0 to 332.8 g/L).
Emission spectra were measured (bottom read) using SpectraMax M5 fluorescence microplate reader (Molecular Devices, CA) from 350 to 650 nm using a 2-nm step increment and a 500 ms integration time. Both spectra were normalized with the maximum luminescent value of the same protein at the maximum emission of Nluc. Ratio (570-590)/ (530-550) was calculated as the sum of emitted light from 570 to 590 nm on the sum of emitted light from 530 to 550 nm for each construct through the phantom. Similar approach was followed for the (570-590)/(450-470) and (530-550)/(450-470) ratios.
Results and Discussion
Hemoglobin absorption spectrum
Hemoglobin, the main absorber of visible light in vivo , is wellknown to limit BLI sensitivity. Using the microplate reader SpectraMax M5, we measured the hemoglobin absorptive properties at different concentrations (0 to 8.5 g/L) in TBS (Tri-buffered saline), upon spectral analysis from 350 to 650 nm wavelength. As shown in the Figure 1A, the absorption spectra of hemoglobin at 2.1 g/L concentration and bellow were found to be within the non-saturating detection range of the SpectraMax M5.
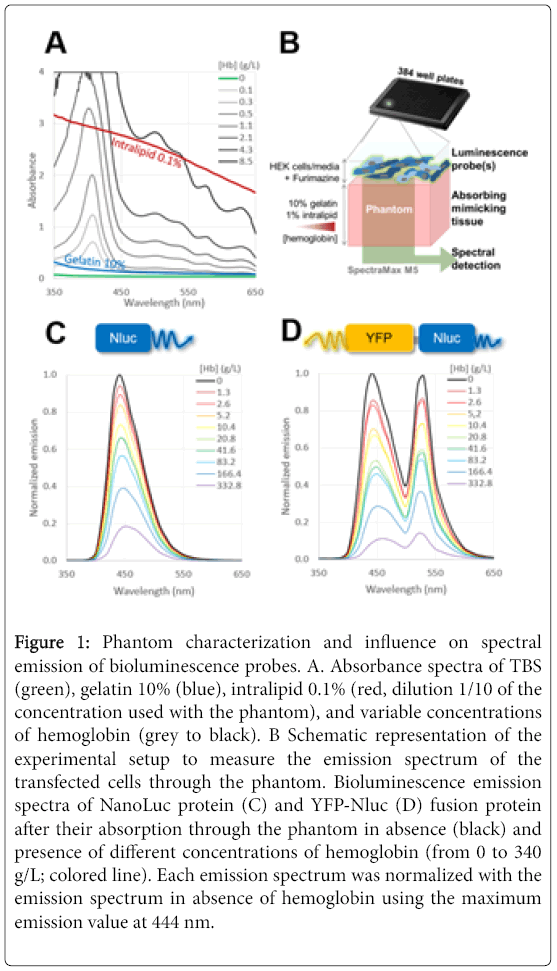
Figure 1: Phantom characterization and influence on spectral emission of bioluminescence probes. A. Absorbance spectra of TBS (green), gelatin 10% (blue), intralipid 0.1% (red, dilution 1/10 of the concentration used with the phantom), and variable concentrations of hemoglobin (grey to black). B Schematic representation of the experimental setup to measure the emission spectrum of the transfected cells through the phantom. Bioluminescence emission spectra of NanoLuc protein (C) and YFP-Nluc (D) fusion protein after their absorption through the phantom in absence (black) and presence of different concentrations of hemoglobin (from 0 to 340 g/L; colored line). Each emission spectrum was normalized with the emission spectrum in absence of hemoglobin using the maximum emission value at 444 nm.
Regardless of its concentration, the hemoglobin absorption showed a major pic at 410 nm and minor pics at 500 nm and above. As compared to the absorption spectra of hemoglobin, the intralipid (0.1%, red line) and the gelatin (10%, blue line) absorption spectra were less heterogeneous and showed a smooth drop of their absorption properties toward higher wavelengths.
Characterization of Nluc and YFP-Nluc Protein Emission Spectra through Tissue-Mimicking Phantom
We next assessed the bioluminescence probes Nluc and YFP-Nluc emission spectra after absorption through tissue-mimicking phantom. In our experimental setup, live HEK cells transiently expressing our probes were maintained in cell media solution in presence of Furimazine substrate. The emitted light from the cells located on top of the solid phantom was characterized using the experimental setup as described in Figure 1B. The visible emission spectra region (350–650 nm) of our probes were first measured in presence of gelatin (10%) and intralipid scattering agent (1%), but in absence of hemoglobin (Figures 1C and 1D black curve).
Nluc protein expressed in HEK cells displayed an emission spectrum with a maximum at 444 nm. HEK cells transfected with YFPNluc fusion plasmid displayed a bioluminescent emission spectrum with two distinctive peaks: the first one at 444 nm and the second one at 530 nm. The first peak matched with the emission peak of Nluc at 444 nm and the second peak with the emission peak of YFP at 530 nm. The presence of two peaks on the emission spectrum of the cells transfected with YFP-Nluc, highlighted BRET from Nluc to YFP. This energy transfer was enabled by the overlap between the emission spectrum of Nluc as a donor and the excitation spectrum of YFP as an acceptor [23].
We next aimed to characterize the spectrum of bioluminescence probes emitted through the solid phantom in presence of fix composition of gelatin (10%), and intralipid (1%), but variable concentrations of hemoglobin (main absorber in vivo ) to simulate the optical properties of tissues. The complex absorption properties of hemoglobin (Figure 1A) are expected to drastically influence the light propagation and absorption of our bioluminescence probes through the gelatin phantom according to the wavelength. As shown in (Figures 1C and 1D), we normalized each emission spectrum (color lines) with their maximum emission at 444 nm (emission peak of Nluc) measured through the phantom in absence of hemoglobin (black bold curve).
The comparison between emission spectra of Nluc and YFP-Nluc after their absorption through the tissue-mimicking phantom, showed as expected, a major absorption of the emitted light with an increase of concentration of hemoglobin (Figure 2). While focusing on the global shape of emission spectra of both Nluc and YFP-Nluc, we could notice the emission peak at 444 nm became more splayed with the increase of hemoglobin concentration (Figure 1C). Furthermore, the relative intensity of the peaks at 444 nm and 530 nm seemed to be reversed (Figure 1D). Indeed, the peak at 530 nm became predominant over the peak at 444 nm for higher concentration of hemoglobin.
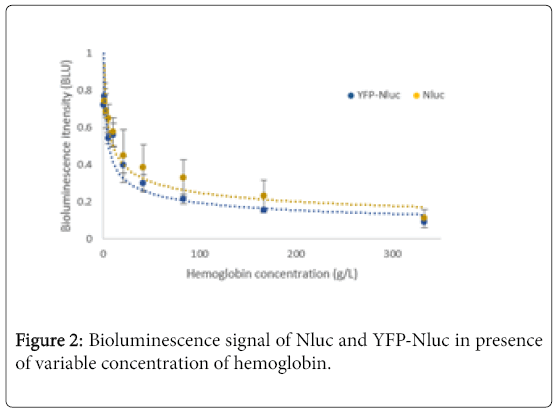
Figure 2: Bioluminescence signal of Nluc and YFP-Nluc in presence of variable concentration of hemoglobin.
Bioluminescence Wavelength Dependence of YFP-Nluc Hemoglobin Concentration
Each bioluminescence spectrum emitted from Nluc or YFP-Nluc through the phantom were next normalized using the maximum emission peak of the Nluc (Figures 3A and 3B). Upon observation of Nluc spectra the maximum intensity peak shift toward higher wavelength upon increase concentration of hemoglobin (Figures 3A, arrow-1). No significant correlation was found between the maximum emission wavelength of Nluc and the hemoglobin concentration (R2=0.4153).
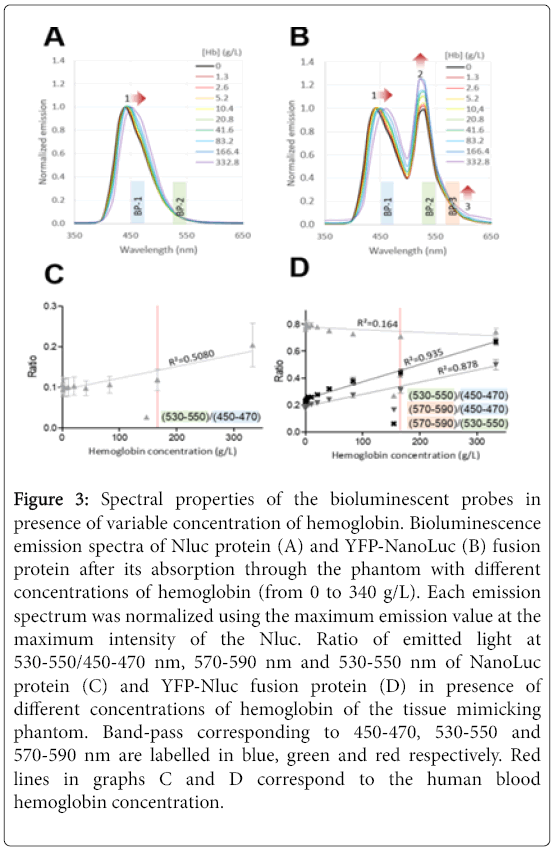
Figure 3: Spectral properties of the bioluminescent probes in presence of variable concentration of hemoglobin. Bioluminescence emission spectra of Nluc protein (A) and YFP-NanoLuc (B) fusion protein after its absorption through the phantom with different concentrations of hemoglobin (from 0 to 340 g/L). Each emission spectrum was normalized using the maximum emission value at the maximum intensity of the Nluc. Ratio of emitted light at 530-550/450-470 nm, 570-590 nm and 530-550 nm of NanoLuc protein (C) and YFP-Nluc fusion protein (D) in presence of different concentrations of hemoglobin of the tissue mimicking phantom. Band-pass corresponding to 450-470, 530-550 and 570-590 nm are labelled in blue, green and red respectively. Red lines in graphs C and D correspond to the human blood hemoglobin concentration.
Similarly, the first maximum intensity peak at 440 nm of the YFPNluc was shifted in presence of hemoglobin (332.8 g/L) by 16 nm (Figure 3B, arrow-1). In Figure 1A, there is an emission wavelength shift of Nluc that is observed in the presence of hemoglobin. This can be explained by the steep drop of the hemoglobin absorption wavelengths above 450 nm which leads to a strong absorption of the bioluminescent signal of the Nluc bellow 450 nm. As a result, the 440- nm maximum intensity peak of the Nluc is strongly reduced, and emission wavelengths above 450 nm are increasingly dominant in presence of hemoglobin
For the YFP-Nluc it should be noticed that the bioluminescence intensity of the second peak increase with the concentration level of hemoglobin (Figure 3B, red arrow-2). Last, we observed similar trend at the tail of the YFP-Nluc spectrum (Figure 3B, arrow-3). Taking advantage of such observation, we selected three narrow band-pass selection (20 nm) within the spectral area of interest which provide a minimum of 10% or more of the maximum emission. The band-pass spectral regions selected (1) 450-470 nm, (2) 530-550 nm and (3) 570-590 nm where named BP1, BP2 and BP3 respectively (Figures 3A and 3B). Next in order to quantify the spectral changes according to the hemoglobin concentration but independently from the bioluminescence signal, ratios of bioluminescence signal obtained with the narrow band-pass were calculated. As shown in Figures 3C and 3D, we found the best correlation between hemoglobin concentration and the ratio (570-590)/(530-550) and (570-590)/(450-470) for the YFPNluc probe with the R² value at 0.935 and 0.878 respectively. The (530-550)/(450-470) ratio from the Nluc or YFP-Nluc however showed poor correlation with the hemoglobin concentration.
Our results showing that at given concentration of hemoglobin, YFP-Nluc BP3/BP-2 bioluminescence ratio strongly correlated to tissue-mimicking phantom hemoglobin concentration, suggest possibility to determine depth localization in living animal tissues. Furthermore, it should be noticed that the hemoglobin concentrations used in this experiment from 0 to 332 g/L covered the human blood which is approximately 160 g/L. However, in order to further validate YFP-Nluc bioluminescence probe additional experiments needed to be performed using (1) either solid optical phantoms as the ones used to calibrate optical imaging instruments or with (2) small animal models. Indeed, we should in future studies take into consideration tissue heterogeneity known to dramatically redirect the light path due to various tissue composition and density.
Conclusion
By comparing the proportion of light collected by the camera at different wavelength the YFP-Nluc probe such as already reported dual-wavelength fluorescent [25] or bioluminescent [26-29] probes enable a straightforward method to estimate the depth of the signal. Altogether the extreme brightness of the Nluc together with the broadspectra bioluminescent probe is an alternative to current in vivo optical tomography approaches to assess the depth of the reporter together with expression quantification without the need for expensive camera and tomography setup.
Acknowledgements
This work was supported by the National Research foundation of Korea (NRF) grant funded by the Korea government (MSIP) (NRF-2014K1A4A7A01074642; 2017M3A9G6068257), Gyeonggi-do. This work was also funded by the NRF individual scientist support program (NRF-2012R1A1A2004980/ NRF-2015R1D1A1A09057239).
References
- Dickson PV, Cathy Ng, Zhou JM, McCarville B, Davidoff A (2005) In vivo bioluminescence imaging for early detection and monitoring of disease progression in a murine model of neuroblastoma. J PediatrSurg 201: S53–S54.
- Kim JE, Kalimuthu S, Ahn BC (2015) In Vivo Cell tracking with bioluminescence imaging. Nucl Med Mol Imaging 49: 3–10.
- Zhang QQ, Wu XJ, Wang C, Zhu WS, Wang YL, et al. (2014) Scattering coefficients of mice organs categorized pathologically by spectral domain optical coherence tomography. Biomed Res Int P5.
- Taroni P, Pifferi A, Torricelli A, Comelli D, Cubeddu R (2003) In vivo absorption and scattering spectroscopy of biological tissues. Photochem. Photobiol Sci 2: 124-129.
- Jacques SL (2013) Optical properties of biological tissues: A review. Phys Med Biol 58: 37-61.
- Wilson BC, Jacques SL (1990) Optical reflectance and transmittance of tissues: Principles and applications. IEEE J Quantum Electron 26: 2186–2199.
- Aswendt M, Adamczak J, Tennstaedt A (2014) A review of novel optical imaging strategies of the stroke pathology and stem cell therapy in stroke. Front Cell Neurosci 8: 226.
- Contag CH, Bachmann MH (2002) Advances inin vivo bioluminescence imaging of gene expression. Annu Rev Biomed Eng 4: 235–260.
- Wang G, Cong W, Shen H, Qian X, Henry M, et al. (2008) Overview of bioluminescence tomography-a new molecular imaging modality. Front Biosci 13: 1281–1293.
- Han W, Wang G (2008) Bioluminescence tomography: Biomedical background, mathematical theory, and numerical approximation. J Comput Math 26: 324–335.
- Wang G, Li Y, Jiang M (2004) Uniqueness theorems in bioluminescence tomography. Med Phys 31: 2289–2299.
- Han W, Kazmi K, Cong W, Wang G (2007) Bioluminescence tomography with optimized optical parameters. Inverse Problems 23: 1215–1228.
- Qin C, Feng J, Zhu S, Ma X, Zhong J, et al. (2014) Recent advances in bioluminescence tomography: Methodology and system as well as application. Laser Photonics Rev 8: 94–114.
- Paroo Z, Bollinger RA, Braasch DA, Richer E, Corey DR, et al. (2004) Validating bioluminescence imaging as a high-throughput, quantitative modality for assessing tumor burden. Mol Imaging 3: 117-124.
- Lewis MA, Richer E, Slavine NV, Soesbe TC, Kodibagkar VD, et al. (2013)A multi-camera system for bioluminescence tomography in Preclinical oncology research. Diagnostics 3: 325–343.
- Chaudhari AJ, Darvas F, Bading JR, Moats RA, Conti PS, et al. (2005) Hyperspectral and multispectral bioluminescence optical tomography for small animal imaging. Phys Med Biol 50: 5421–5441.
- Wang G, Shen H, Durairaj K, Qian X, Cong W (2006) The first bioluminescence tomography system for simultaneous acquisition of multiview and multispectral data. Int J Biomed Imaging 2006: 1–8.
- Kuo C, Coquoz O, Troy TL, Xu H, Rice BW (2007) Three-dimensional reconstruction of in vivo bioluminescent sources based on multispectral imaging. J Biomed Opt 12: 24007.
- Zhang J, Chen D, Liang J, Xue H, Lei J, et al. (2014) Incorporating MRI structural information into bioluminescence tomography: System, heterogeneous reconstruction and in vivo quantification. Biomed Opt Express 5: 1861-1867.
- Peter J, Unholtz D, Member S, Schulz RB, Doll J, et al. ( 2007) Development and initial results of a tomographic dual-modality Positron/optical Small Animal Imager 54: 1553–1560.
- Cronin M, Akin AR, Collins SA, Meganck J, Kim JB, et al. (2012) High resolution in vivo bioluminescent imaging for the study of bacterial tumour targeting. PLoS One 7: e30940.
- Hall MP, Unch J, Binkowski BF, Valley MP, Butler BL, et al. (2012) Engineered luciferase reporter from a deep sea shrimp utilizing a novel imidazopyrazinone substrate. ACS Chem Biol 7: 1848–1857.
- Kim J, Grailhe R (2016) Nanoluciferase signal brightness using furimazine substrates opens bioluminescence resonance energy transfer to widefield microscopy. Cytometry Part A 89: 742–746.
- De Grand AM, Lomnes SJ, Lee DS, Pietrzykowski M, Ohnishi S, et al. (2006) Tissue-like phantoms for near-infrared fluorescence imaging system assessment and the training of surgeons. J Biomed Opt 11: 14007.
- Miller JP, Maji D, Lam J, Tromberg BJ, Achilefu S (2017) Noninvasive depth estimation using tissue optical properties and a dual-wavelength fluorescent molecular probe in vivo. Biomed Opt Express 8: 3095–3109.
- Zhao H, Doyle TC, Coquoz O, Kalish F, Rice BW, et al. (2005) Emission spectra of bioluminescent reporters and interaction with mammalian tissue determine the sensitivity of detection in vivo. J Biomed Opt 10: 41210.
- Guggenheim JA, Basevi HR, Frampton J, Styles IB, Dehghani H (2013) Multi-modal molecular diffuse optical tomography system for small animal imaging. Meas Sci Technol 24: 105405.
- Zhang S, Leng C, Liu H, Wang K, Tian J (2017) Fast in vivo bioluminescence tomography using a novel pure optical imaging technique. JInnovOpt Health Sci 10: 12.
- Liu J, Wang Y, Qu X, Li X, Ma X, et al. (2010) In vivo quantitative bioluminescence tomography using heterogeneous and homogeneous mouse models. Opt Express 18: 13102–13113.
Citation: Boitet M, Grailhe R (2017) Reporter Expression and Tissue Depth Quantification Using Bright and Broad-Range Spectrum Bioluminescence Probes. Biosens J 6: 1000148 DOI: 10.4172/2090-4967.1000148
Copyright: ©2017 Boitet M, et al. This is an open-access article distributed under the terms of the Creative Commons Attribution License, which permits unrestricted use,distribution, and reproduction in any medium, provided the original author and source are credited.
Share This Article
Open Access Journals
Article Tools
Article Usage
- Total views: 16286
- [From(publication date): 0-2017 - Dec 06, 2023]
- Breakdown by view type
- HTML page views: 15497
- PDF downloads: 789